
The Great Inflation
1965-1982
![Close-up of a "Whip Inflation Now" [WIN] button, President Ford's symbol of the fight against inflation.](/-/media/Project/FedHistory/FedHistory/Images/great_inflation_1_720x450.jpg?h=450&iar=0&w=720&hash=4BE729FA10DF3916273A197B0A128E4A)
The Great Inflation was the defining macroeconomic event of the second half of the twentieth century. Over the nearly two decades it lasted, the global monetary system established during World War II was abandoned, there were four economic recessions, two severe energy shortages, and the unprecedented peacetime implementation of wage and price controls. It was, according to one prominent economist, "the greatest failure of American macroeconomic policy in the postwar period" (Siegel 1994).
But that failure also brought a transformative change in macroeconomic theory and, ultimately, the rules that today guide the monetary policies of the Federal Reserve and other central banks around the world. If the Great Inflation was a consequence of a great failure of American macroeconomic policy, its conquest should be counted as a triumph.
Forensics of the Great Inflation
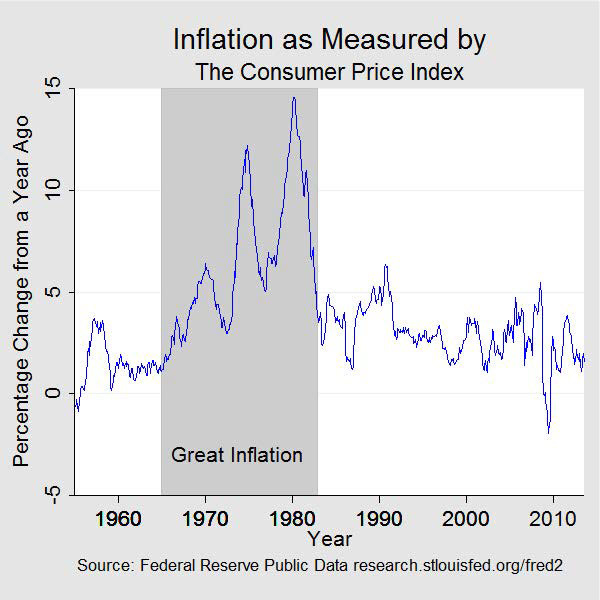
In 1964, inflation measured a little more than 1 percent per year. It had been in this vicinity over the preceding six years. Inflation began ratcheting upward in the mid-1960s and reached more than 14 percent in 1980. It eventually declined to average only 3.5 percent in the latter half of the 1980s.
While economists debate the relative importance of the factors that motivated and perpetuated inflation for more than a decade, there is little debate about its source. The origins of the Great Inflation were policies that allowed for an excessive growth in the supply of money—Federal Reserve policies.
To understand this episode of especially bad policy, and monetary policy in particular, it will be useful to tell the story in three distinct but related parts. This is a forensic investigation of sorts, examining the motive, means, and opportunity for the Great Inflation to occur.
The Motive: The Phillips Curve and the Pursuit of Full Employment
The first part of the story, the motive underlying the Great Inflation, dates back to the immediate aftermath of the Great Depression, an earlier and equally transformative period for macroeconomic theory and policy. At the conclusion of World War II, Congress turned its attention to policies it hoped would promote greater economic stability. Most notable among the laws that emerged was the Employment Act of 1946. Among other things, the act declared it a responsibility of the federal government "to promote maximum employment, production, and purchasing power" and provided for greater coordination between fiscal and monetary policies.1 This act is the seminal basis for the Federal Reserve's current dual mandate to "maintain long run growth of the monetary and credit aggregates... so as to promote effectively the goals of maximum employment, stable prices and moderate long-term interest rates" (Steelman 2011).
The orthodoxy guiding policy in the post-WWII era was Keynesian stabilization policy, motivated in large part by the painful memory of the unprecedented high unemployment in the United States and around the world during the 1930s. The focal point of these policies was the management of aggregate spending (demand) by way of the spending and taxation policies of the fiscal authority and the monetary policies of the central bank. The idea that monetary policy can and should be used to manage aggregate spending and stabilize economic activity is still a generally accepted tenet that guides the policies of the Federal Reserve and other central banks today. But one critical and erroneous assumption to the implementation of stabilization policy of the 1960s and 1970s was that there existed a stable, exploitable relationship between unemployment and inflation. Specifically, it was generally believed that permanently lower rates of unemployment could be "bought" with modestly higher rates of inflation.
The idea that the "Phillips curve" represented a longer-term trade-off between unemployment, which was very damaging to economic well-being, and inflation, which was sometimes thought of as more of an inconvenience, was an attractive assumption for policymakers who hoped to forcefully pursue the dictates of the Employment Act.2 But the stability of the Phillips curve was a fateful assumption, one that economists Edmund Phelps (1967) and Milton Friedman (1968) warned against. Said Phelps "[I]f the statical 'optimum' is chosen, it is reasonable to suppose that the participants in product and labour markets will learn to expect inflation... and that, as a consequence of their rational, anticipatory behaviour, the Phillips Curve will gradually shift upward..." (Phelps 1967; Friedman 1968). In other words, the trade-off between lower unemployment and more inflation that policymakers may have wanted to pursue would likely be a false bargain, requiring ever higher inflation to maintain.
The Means: The Collapse of Bretton Woods
Chasing the Phillips curve in pursuit of lower unemployment could not have occurred if the policies of the Federal Reserve were well-anchored. And in the 1960s, the US dollar was anchored—albeit very tenuously—to gold through the Bretton Woods agreement. So the story of the Great Inflation is in part also about the collapse of the Bretton Woods system and the separation of the US dollar from its last link to gold.
During World War II, the world's industrial nations agreed to a global monetary system that they hoped would bring greater economic stability and peace by promoting global trade. That system, hashed out by forty-four nations in Bretton Woods, New Hampshire, during July 1944, provided for a fixed rate of exchange between the currencies of the world and the US dollar, and the US dollar was linked to gold.3
But the Bretton Woods system had a number of flaws in its implementation, chief among them the attempt to maintain fixed parity between global currencies that was incompatible with their domestic economic goals. Many nations, it turned out, were pursing monetary policies that promised to march up the Phillips curve for a more favorable unemployment-inflation nexus.
As the world's reserve currency, the US dollar had an additional problem. As global trade grew, so too did the demand for U.S. dollar reserves. For a time, the demand for US dollars was satisfied by an increasing balance of payments shortfall, and foreign central banks accumulated more and more dollar reserves. Eventually, the supply of dollar reserves held abroad exceeded the US stock of gold, implying that the United States could not maintain complete convertibility at the existing price of gold—a fact that would not go unnoticed by foreign governments and currency speculators.
As inflation drifted higher during the latter half of the 1960s, US dollars were increasingly converted to gold, and in the summer of 1971, President Nixon halted the exchange of dollars for gold by foreign central banks. Over the next two years, there was an attempt to salvage the global monetary system through the short-lived Smithsonian Agreement, but the new arrangement fared no better than Bretton Woods and it quickly broke down. The postwar global monetary system was finished.
With the last link to gold severed, most of the world's currencies, including the US dollar, were now completely unanchored. Except during periods of global crisis, this was the first time in history that most of the monies of the industrialized world were on an irredeemable paper money standard.
The Opportunity: Fiscal Imbalances, Energy Shortages, and Bad Data
The late 1960s and the early 1970s were a turbulent time for the US economy. President Johnson's Great Society legislation brought about major spending programs across a broad array of social initiatives at a time when the US fiscal situation was already being strained by the Vietnam War. These growing fiscal imbalances complicated monetary policy.
In order to avoid monetary policy actions that might interfere with the funding plans of the Treasury, the Federal Reserve followed a practice of conducting "even-keel" policies. In practical terms, this meant the central bank would not implement a change in policy and would hold interest rates steady during the period between the announcement of a Treasury issue and its sale to the market. Under ordinary conditions, Treasury issues were infrequent and the Fed's even-keel policies didn't significantly interfere with the implementation of monetary policy. But as debt issues became more prevalent, the Federal Reserve's adherence to the even-keel principle increasingly constrained the conduct of monetary policy (Meltzer 2005).
A more disruptive force was the repeated energy crises that increased oil costs and sapped U.S. growth. The first crisis was an Arab oil embargo that began in October 1973 and lasted about five months. During this period, crude oil prices quadrupled to a plateau that held until the Iranian revolution brought a second energy crisis in 1979. The second crisis tripled the cost of oil.
In the 1970s, economists and policymakers began to commonly categorize the rise in aggregate prices as different inflation types. "Demand-pull" inflation was the direct influence of macroeconomic policy, and monetary policy in particular. It resulted from policies that produced a level of spending in excess of what the economy could produce without pushing the economy beyond its ordinary productive capacity and pulling more expensive resources into play. But inflation could also be pushed higher from supply disruptions, notably originating in food and energy markets (Gordon 1975).4 This "cost-push" inflation also got passed through the chain of production into higher retail prices.
From the perspective of the central bank, the inflation being caused by the rising price of oil was largely beyond the control of monetary policy. But the rise in unemployment that was occurring in response to the jump in oil prices was not.
Motivated by a mandate to create full employment with little or no anchor for the management of reserves, the Federal Reserve accommodated large and rising fiscal imbalances and leaned against the headwinds produced by energy costs. These policies accelerated the expansion of the money supply and raised overall prices without reducing unemployment.
Bad data (or at least a bad understanding of the data) also handicapped policymakers. Looking back at the information policymakers had in hand during the period leading up to and during the Great Inflation, economist Athanasios Orphanides has shown that the real-time estimate of potential output was significantly overstated, and the estimate of the rate of unemployment consistent with full employment was significantly understated. In other words, policymakers were also likely underestimating the inflationary effects of their policies. In fact, the policy path they were on simply wasn't feasible without accelerating inflation (Orphanides 1997; Orphanides 2002).
And to make matters worse yet, the Phillips curve, the stability of which was an important guide to the policy decisions of the Federal Reserve, began to move.
From High Inflation to Inflation Targeting—The Conquest of US Inflation
Phelps and Friedman were right. The stable trade-off between inflation and unemployment proved unstable. The ability of policymakers to control any "real" variable was ephemeral. This truth included the rate of unemployment, which oscillated around its "natural" rate. The trade-off that policymakers hoped to exploit did not exist.
As businesses and households came to appreciate, indeed anticipate, rising prices, any trade-off between inflation and unemployment became a less favorable exchange until, in time, both inflation and unemployment became unacceptably high. This, then, became the era of "stagflation." In 1964, when this story began, inflation was 1 percent and unemployment was 5 percent. Ten years later, inflation would be over 12 percent and unemployment was above 7 percent. By the summer of 1980, inflation was near 14.5 percent, and unemployment was over 7.5 percent.
Federal Reserve officials were not blind to the inflation that was occurring and were well aware of the dual mandate that required monetary policy to be calibrated so that it delivered full employment and price stability. Indeed, the Employment Act of 1946 was re-codified in 1978 by the Full Employment and Balanced Growth Act, more commonly known as the Humphrey-Hawkins Act after the bill's authors. Humphrey-Hawkins explicitly charged the Federal Reserve to pursue full employment and price stability, required that the central bank establish targets for the growth of various monetary aggregates, and provide a semiannual Monetary Policy Report to Congress.5 Nevertheless, the employment half of the mandate appears to have had the upper hand when full employment and inflation came into conflict. As Fed Chairman Arthur Burns would later claim, full employment was the first priority in the minds of the public and the government, if not also at the Federal Reserve (Meltzer 2005). But there was also a clear sense that addressing the inflation problem head-on would have been too costly to the economy and jobs.
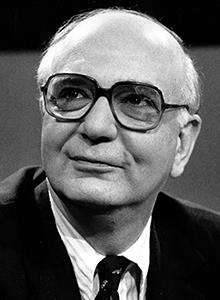
There had been a few earlier attempts to control inflation without the costly side effect of higher unemployment. The Nixon administration introduced wage and price controls over three phases between 1971 and 1974. Those controls only temporarily slowed the rise in prices while exacerbating shortages, particularly for food and energy. The Ford administration fared no better in its efforts. After declaring inflation "enemy number one," the president in 1974 introduced the Whip Inflation Now (WIN) program, which consisted of voluntary measures to encourage more thrift. It was a failure.
By the late 1970s, the public had come to expect an inflationary bias to monetary policy. And they were increasingly unhappy with inflation. Survey after survey showed a deteriorating public confidence over the economy and government policy in the latter half of the 1970s. And often, inflation was identified as a special evil. Interest rates appeared to be on a secular rise since 1965 and spiked sharply higher still as the 1970s came to a close. During this time, business investment slowed, productivity faltered, and the nation's trade balance with the rest of the world worsened. And inflation was widely viewed as either a significant contributing factor to the economic malaise or its primary basis.
But once in the position of having unacceptably high inflation and high unemployment, policymakers faced an unhappy dilemma. Fighting high unemployment would almost certainly drive inflation higher still, while fighting inflation would just as certainly cause unemployment to spike even higher.
In 1979, Paul Volcker, formerly the president of the Federal Reserve Bank of New York, became chairman of the Federal Reserve Board. When he took office in August, year-over-year inflation was running above 11 percent, and national joblessness was just a shade under 6 percent. By this time, it was generally accepted that reducing inflation required greater control over the growth rate of reserves specifically, and broad money more generally. The Federal Open Market Committee (FOMC) had already begun establishing targets for the monetary aggregates as required by the Humphrey-Hawkins Act. But it was clear that sentiment was shifting with the new chairman and that stronger measures to control the growth of the money supply were required. In October 1979, the FOMC announced its intention to target reserve growth rather than the fed funds rate as its policy instrument.
Fighting inflation was now seen as necessary to achieve both objectives of the dual mandate, even if it temporarily caused a disruption to economic activity and, for a time, a higher rate of joblessness. In early 1980, Volcker said, "[M]y basic philosophy is over time we have no choice but to deal with the inflationary situation because over time inflation and the unemployment rate go together.... Isn't that the lesson of the 1970s?" (Meltzer 2009, 1034).
Over time, greater control of reserve and money growth, while less than perfect, produced a desired slowing in inflation. This tighter reserve management was augmented by the introduction of credit controls in early 1980 and with the Monetary Control Act. Over the course of 1980, interest rates spiked, fell briefly, and then spiked again. Lending activity fell, unemployment rose, and the economy entered a brief recession between January and July. Inflation fell but was still high even as the economy recovered in the second half of 1980.
But the Volcker Fed continued to press the fight against high inflation with a combination of higher interest rates and even slower reserve growth. The economy entered recession again in July 1981, and this proved to be more severe and protracted, lasting until November 1982. Unemployment peaked at nearly 11 percent, but inflation continued to move lower and by recession's end, year-over-year inflation was back under 5 percent. In time, as the Fed's commitment to low inflation gained credibility, unemployment retreated and the economy entered a period of sustained growth and stability. The Great Inflation was over.
By this time, macroeconomic theory had undergone a transformation, in large part informed by the economic lessons of the era. The important role public expectations play in the interplay between economic policy and economic performance became de rigueur in macroeconomic models. The importance of time-consistent policy choices—policies that do not sacrifice longer-term prosperity for short-term gains—and policy credibility became widely appreciated as necessary for good macroeconomic results.
Today central banks understand that a commitment to price stability is essential for good monetary policy and most, including the Federal Reserve, have adopted specific numerical objectives for inflation. To the extent they are credible, these numerical inflation targets have reintroduced an anchor to monetary policy. And in so doing, they have enhanced the transparency of monetary policy decisions and reduced uncertainty, now also understood to be necessary antecedents to the achievement of long-term growth and maximum employment.
Endnotes
- 1 The act also created the president's Council of Economic Advisers.
- 2 The Phillips curve is a negative, statistical relationship between inflation (or nominal wage growth) and the rate of unemployment. It is named after British economist A.W. Phillips, who is often credited with the revelation of the relations. Phillips, A.W. "The Relationship between Unemployment and the Rate of Change of Money Wages in the United Kingdom 1861-1957." Economica 25, no. 100 (1958): 283-99. https://www.jstor.org/stable/2550759.
- 3 Dollars were convertible for gold by foreign governments and central banks. For domestic purposes, the US dollar was separated from gold in 1934 and has remained unconvertible since.
- 4 The concept of core inflation—the measurement of aggregate prices excluding food and energy goods—has its origin about this time.
- 5 The Humphrey-Hawkins Act expired in 2000; the Federal Reserve continues to provide its Monetary Policy Report to Congress on a semiannual basis.
Bibliography
Friedman, Milton. "The Role of Monetary Policy." American Economic Review 58, no. 1 (March 1968): 1-17.
Gordon, Robert J. "Alternative Responses of Policy to External Supply Shocks." Brookings Papers on Economic Activity 6, no. 1 (1975): 183-206.
Meltzer, Allan H., "Origins of the Great Inflation," Federal Reserve Bank of St. Louis Review 87, no. 2, part 2 (March/April 2005): 145-75.
Meltzer, Allan H. A History of the Federal Reserve, Volume 2, Book 2, 1970-1986. Chicago: University of Chicago Press, 2009.
Orphanides, Athanasios, "Monetary Policy Rules Based on Real-Time Data," Finance and Economics Discussion Series 1998-03, Federal Reserve Board, Washington, DC, December 1997.
Orphanides, Athanasios, "Monetary Policy Rules and the Great Inflation," Finance and Economics Discussion Series 2002-08, Federal Reserve Board, Washington, DC, January 2002.
Phelps, E.S. "Phillips Curves, Expectations of Inflation and Optimal Unemployment Over Time." Economica 34, no. 135 (August 1967): 254-81.
Phillips, A.W. "The Relation between Unemployment and the Rate of Change of Money Wage Rates in the United Kingdom 1861-1957." Economica 25, no. 100 (1958): 283-99.
Siegel, Jeremy J. Stocks for the Long Run: A Guide to Selecting Markets for Long-Term Growth, 2nd ed. New York: McGraw-Hill, 1994.
Steelman, Aaron. "The Federal Reserve's 'Dual Mandate': The Evolution of an Idea." Federal Reserve Bank of Richmond Economic Brief no. 11-12 (December 2011).
Written as of November 22, 2013. See disclaimer and update policy.

 facebook
 email
email