
The Great Moderation
1982-2007
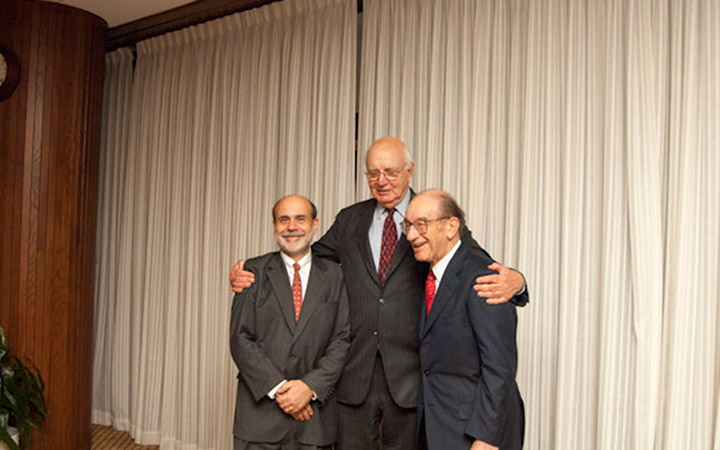
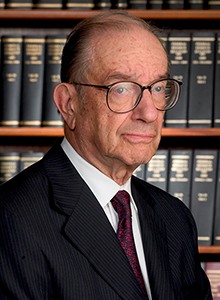
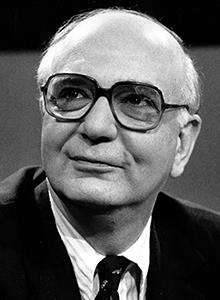
The Great Moderation from the mid-1980s to 2007 was a welcome period of relative calm after the volatility of the Great Inflation.1 Under the chairmanships of Volcker (ending in 1987), Greenspan (1987-2006) and Bernanke (starting in 2006), inflation was low and relatively stable, while the period contained the longest economic expansion since World War II. Looking back, economists may differ on what roles were played by the different factors in contributing to the Great Moderation, but one thing is sure: Better monetary policy was key. Unfortunately, the financial crisis of 2007-08 and the ensuing Great Recession broke the calm of the Great Moderation. An important question for Federal Reserve policymakers—and for other policymakers in the United States and worldwide—is whether the disruption beginning in 2007 was a temporary blip or reflects a shift to a more volatile economy going forward.
Defining the Great Moderation
The significant decline in macroeconomic volatility that began in the mid-1980s and came to be known as the Great Moderation has been documented by many, including Stock and Watson (2003), Bernanke (2004), and Clark (2009). It was not simply a US phenomenon; it occurred around the same time in many other advanced economies.
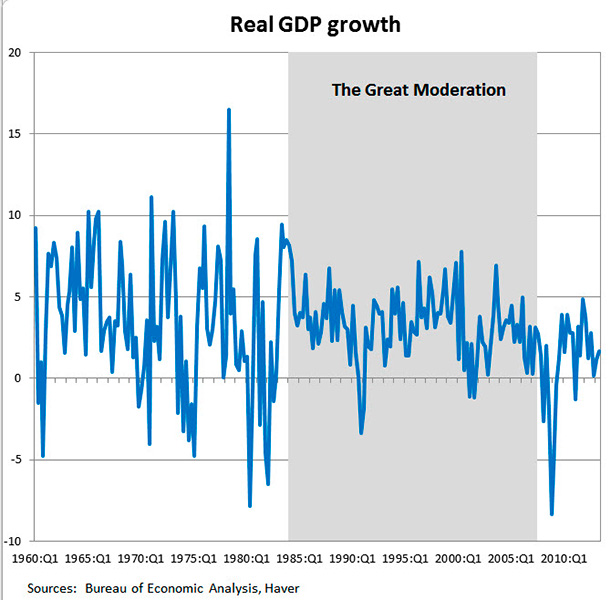
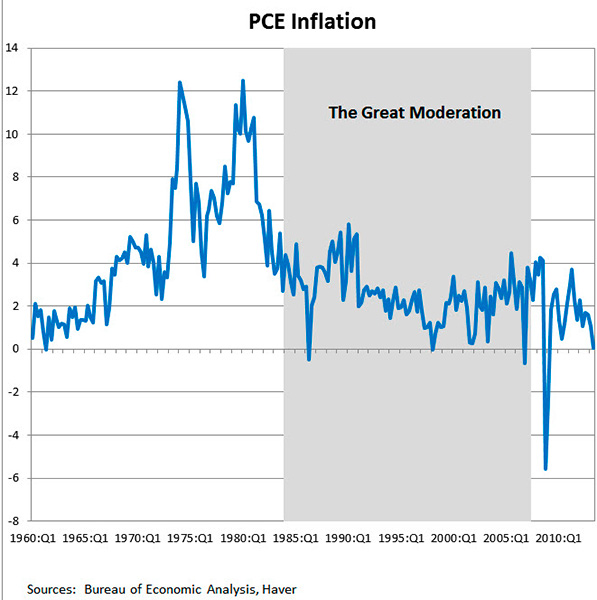
Chart 1 and Chart 2 visually illustrate the Great Moderation by showing real GDP growth and personal consumption expenditure inflation from 1960 to the present. While economists have reached no consensus on the period's exact start and end dates, the chart dates the Great Moderation as between 1984 and mid-2007. The chart clearly shows the decline in volatility both in real GDP growth and in inflation.
What Caused the Great Moderation?
Reducing inflation and establishing basic price stability laid the foundation for the Great Moderation. But, in looking for deeper reasons, economists have generally proposed three reasons: changes in the structure of the economy, good luck, and good policy.
Changes in the structure of the economy can reduce volatility. For example, since manufacturing tends to be volatile, the shift that occurred from manufacturing to services would tend to reduce volatility. Another structural change would be the adoption of "just-in-time" inventory practices, which reduces the volatility of the inventory cycle. Similarly, advances in information technology and communications may have allowed firms to produce more efficiently and monitor their production processes more effectively, thereby reducing volatility in production—and thus in real GDP. Deregulation of many industries may have contributed to the increasing flexibility of the economy and thereby allow the economy to adjust more smoothly to shocks of various kinds, thus leading to its greater stability. Finally, more open international trade and capital flows may have helped make the economy more stable.
Good luck is another possible explanation. Perhaps the United States was simply lucky that shocks hitting the economy during the Great Moderation were smaller than the large, adverse shocks of the 1960s and 1970s. The powerful oil price shocks of that earlier period are the most obvious example. Economists who argue for the "good luck" story generally rely on estimating statistical models. For example, Stock and Watson (2003) consider the estimated residuals from their models as proxies for shocks to the economy and conclude that volatility declined due to good luck.
However, as Bank of England Deputy Governor Charles Bean pointed out in 2009, "shocks are not measured directly, only their consequences" (Bean 2009). In this view, rather than "good luck" or "smaller shocks," it could be that structural changes and good policy had reduced the economy's vulnerability to the shocks that occurred.
Nobel Laureate Christopher Sims has offered an analogy in which fire extinguishers limit the impact of a kitchen fire, even a large one, on a kitchen's room temperature. Effective monetary policy or structural changes in the economy—like a pair of good fire extinguishers—may limit the adverse impact of even a major shock. If the extinguishers were used quickly and effectively, Sims pointed out, the kitchen's room temperature might rise only slightly and briefly. But "had the fire extinguishers not been used, the temperature in the kitchen would have developed very differently that evening." But in either case, the "shock" that caused the fire was the same (Sims 2012).
One bit of evidence supporting this assertion is the actual number of "large shocks" that did hit the US economy during the Great Moderation. Many of the event studies associated with this essay—the Latin American debt crisis of the 1980s, the failure of Continental Illinois Bank in 1984, the stock market crash of 1987, the Asian financial crisis in 1997, the collapse of Long-Term Capital Management in 1998, and the dot-com crash in 2000—suggest that the economy was hit by many large shocks during the time of the Great Moderation. These events, and others, lead us to wonder if the Great Moderation really was a period of "smaller shocks."
Finally, good policy, especially monetary policy, is the third possible reason for the Great Moderation. Monetary policy is generally thought to have performed better during the Great Moderation than in earlier periods. After inflation climbed from below 2 percent in the mid-1960s to over 12 percent in the mid-1970s, Federal Reserve Chairman Paul Volcker brought it down and returned the focus of monetary policy to price stability, thereby laying the foundation for the Great Moderation.
While most explanations of the Great Moderation focus on these three factors, there is considerable disagreement on which explanation is the main reason. For example, Stock and Watson (2003) believe that "smaller shocks" are the key factor. However, as Federal Reserve Board Governor (but not yet chairman) Ben Bernanke noted in 2004, "each of the three classes of explanation I have described probably contains elements of truth.... My view is that improvements in monetary policy, though certainly not the only factor, have probably been an important source of the Great Moderation" (Bernanke 2004).
What Role Did Monetary Policy Play in the Great Moderation?
During the Great Moderation, the Federal Reserve responded more systematically than it had before to deviations of inflation and output from their desired levels. The setting of policy turned out to be broadly consistent with what is known as a Taylor-type rule, named after the economist John B. Taylor, who first proposed his rule in 1993. Under this kind of rule, the central bank tightens monetary policy when output is above its potential or inflation is high relative to the policymaker's desired inflation rate and eases policy when the circumstances are reversed. But importantly, the "Taylor Principle" dictates that the federal funds rate should be increased by more than an increase in inflation. In this way, monetary policy, as measured by the "real" federal funds rate, increases in response to an increase in inflation.
A more systematic monetary policy following the Taylor Principle means less policy instability, which should reduce macroeconomic volatility. Prior to the Great Moderation, monetary policy often followed what was called a "go-stop" policy. In general, monetary policy was eased to fight recessions during the "go-phase" and was tightened to combat rising inflation during the "stop-phase." However, prior to the Great Moderation, the Fed would often maintain easy policy for too long leading to higher inflation. It would then tighten policy to fight rising inflation, but not for long enough. As a result, inflation generally rose in an erratic pattern during the 1960s and 1970s.2 By reducing the episodes of "go-stop" policies, a more systematic monetary policy reduces volatility.
Changes in the Federal Reserve's approach to communicating about its monetary policy probably also contributed to the Great Moderation. Better communication and more transparency meant monetary policy could be more effective, for example, by better anchoring inflation expectations, which allows policy to have greater flexibility in responding to short-run developments. Asset prices would reflect the systematic part of policy, which also has a stabilizing influence. And there was less chance for the public and financial markets to be surprised by monetary policy actions. With fewer surprises, there was less cause for volatility. Before 1994, the Federal Reserve's rate-setting Federal Open Market Committee (FOMC) had not announced its policy decisions: Changes had to be inferred by market participants from actions taken by the Open Market Desk of the New York Fed. But on February 4, 1994, the FOMC started issuing a brief statement announcing a decision to change policy. It has expanded that practice since, and it now issues a substantial statement following every FOMC meeting.
The FOMC also became more open in communicating about the likely future path of monetary policy. Beginning in February 2000, the FOMC provided assessments of risks facing the economy. It did so with relatively fixed language initially but used more flexible language later on. The new communications amounted to indirect guidance about the likely path of monetary policy. For example, when the FOMC says it sees a risk of higher inflation, markets conclude the FOMC may soon move toward tighter policy. The FOMC took another step toward more explicit guidance on August 12, 2003, when it said that policy accommodation can be maintained "for a considerable period." Over the next few years, the Committee introduced new phrases, such as "patient," and "measured," to convey information about the likely future path of its policy. Starting in August 2011, after the Great Recession, the FOMC began to use date-based guidance by saying, for example, low interest rates were likely to continue "at least through mid-2013." Longer-term guidance was provided by the FOMC in its "Statement of Longer-Run Goals and Monetary Policy Strategy," which was first issued in January 2012 and gave a desired rate of 2 percent for inflation. Similar precision for the longer-run normal rate of unemployment is not feasible given its dependence on a multitude of nonmonetary factors that may evolve over time, but the Committee has noted its participants' longer-run projections for the unemployment rate, as noted in its Survey of Economic Projections.3
More recently, the central bank began describing economic conditions that would warrant consideration of a change in the federal funds rate, going so far as to specify numerical thresholds for the unemployment rate and inflation that could lead authorities to consider tightening policy.4 The form that the FOMC's communication and forward guidance takes depends on the circumstances. So, as circumstances change, so will the FOMC's communication. For example, when the federal funds rate is constrained by the zero lower bound, the FOMC will necessarily need to communicate its intended policy differently than when the federal funds rate is not constrained by the zero lower bound and more fully reflects the Committee's intended policy.5
Monetary policy also contributed to the Great Moderation through its attention to financial stability. For example, on the day after the October 19, 1987, stock market crash, the Federal Reserve issued the following short statement: "The Federal Reserve, consistent with its responsibilities as the Nation's central bank, affirmed today its readiness to serve as a source of liquidity to support the economic and financial system." The Federal Reserve also quickly responded to the September 11 terrorist attacks by providing liquidity through the discount window and extending credit through its check clearing role (Neely 2002). In both cases, the Federal Reserve's action provided important liquidity to keep markets functioning and prevent an even worse crisis. However, as Chairman Bernanke recently noted, "for the most part, financial stability did not figure prominently in monetary policy discussions during these years [of the Great Moderation]" (Bernanke 2013).
Has the "Great Moderation" Ended?
The financial crisis and Great Recession that started in late 2007 caused some analysts to believe the Great Moderation was over. Clark (2009) showed that levels of volatility, relatively low during the Great Moderation, did increase after 2007. However, in updating his results, Clark showed that, in general, volatility has fallen back, returning to a level comparable to that of the Great Moderation.6 His results suggest the Great Moderation was merely interrupted by the Great Recession and the recent financial crisis, due to a "bad shock" as opposed to long-lasting structural changes in the economy or "bad policy." This is also consistent with the findings of Stock and Watson (2012), who conclude that the severity of the Great Recession "was associated with large unexpected movements in the factors [in their model], not with some new factor or with changes in macroeconomic dynamics."
Only the future will tell for certain whether the Great Moderation is gone or is set to continue after the harrowing interruption of recent years. As long as the changes in the structure of the economy and good policy explained at least part of the Great Moderation, and have not been undone, then we should expect to return at least partially to the Great Moderation. And perhaps with financial stability being a more prominent objective and better integrated with monetary policy, financial shocks such as those seen over the past several years will be less common and have less severe impacts. If the Great Moderation is still with us, its reemergence in the aftermath of the Great Recession will be as welcome now as its first emergence was following the turbulence of the Great Inflation. As for its causes, economists may disagree on the relative importance of different factors, but there is little question that "good policy" played a role. The Great Moderation set a high standard for today's policymakers to strive toward.
Endnotes
- 1 Most economists date the beginning of the Great Moderation as the mid-1980s. However, the Centennial Gateway Project (this site) uses a different convention for dating the various episodes of Federal Reserve history. In particular, since it defines the end of the Great Inflation episode as 1982, this becomes the beginning of the next episode—the Great Moderation.
- 2 "'Constrained Discretion' and Monetary Policy," remarks by Governor Ben S. Bernanke, February 3, 2003, and "The Monetary Policy Debate Since October 1979: Lessons for Theory and Practice," Marvin Goodfriend, Federal Reserve Bank of St. Louis Review, March/April 2005, Part 2, pp. 243-62.
- 3 In January 2012, the central tendency of FOMC participants' estimates of the longer-run normal rate of unemployment was from 5.2 to 6 percent.
- 4 In late 2008 the FOMC began purchasing longer-term government debt, government agency debt, and agency-guaranteed mortgage-backed securities. The Committee has provided guidance about the future path of purchase in its post-meeting statements.
- 5 For example, on April 21, 2009, the Bank of Canada introduced forward guidance with the following statement: "With monetary policy now operating at the effective lower bound for the overnight policy rate, it is appropriate to provide more explicit guidance than is usual regarding its future path so as to influence rates at longer maturities."
- 6 Personal correspondence with Todd Clark, vice president and economist, Federal Reserve Bank of Cleveland.
Bibliography
Bean, Charles, "The Great Moderation, the Great Panic and the Great Contraction," Schumpeter Lecture at the Annual Congress of the European Economic Association, Barcelona, Spain, August 25, 2009.
Bernanke, Ben S., "The Great Moderation," Remarks at the meetings of the Eastern Economic Association, Washington, DC, February 20, 2004.
Bernanke, Ben S., "A Century of U.S. Central Banking: Goals, Frameworks, Accountability," Remarks at "The First 100 Years of the Federal Reserve: The Policy Record, Lessons Learned, and Prospects for the Future," a conference sponsored by the National Bureau of Economic Research, Cambridge, MA, July 10, 2013.
Carlson, Mark, "A Brief History of the 1987 Stock Market Crash with a Discussion of the Federal Reserve Response," Finance and Economics Discussion Series No. 2007-13, Divisions of Research & Statistics and Monetary Affairs, Federal Reserve Board, Washington, DC, November 2006.
Clark, Todd. "Is the Great Moderation Over? An Empirical Analysis," Federal Reserve Bank of Kansas City Economic Review, Fourth Quarter (2009): 5-42.
Neely, Christopher J., "The Federal Reserve's Response to the September 11 Attacks," Federal Reserve Bank of St. Louis The Regional Economist, January 2002.
Sims, Christopher A., "Comment on 'Disentangling the Channels of the 2007-09 Recession,'" Brookings Papers on Economic Activity, Spring 2012, 141-8.
Stock, James H., and Mark W. Watson. "Has the Business Cycle Changed?" Paper presented at the Federal Reserve Bank of Kansas City "Monetary Policy and Uncertainty: Adapting to a Changing Economy" symposium Jackson Hole, WY, August 28-30, 2003.
Stock, James H., and Mark W. Watson, "Disentangling the Channels of the 2007-09 Recession," Brookings Papers on Economic Activity, Spring 2012, 81-156.
Written as of November 22, 2013. See disclaimer and update policy.
 facebook
 email
email